Meta · Internal Tools · 2022–2023
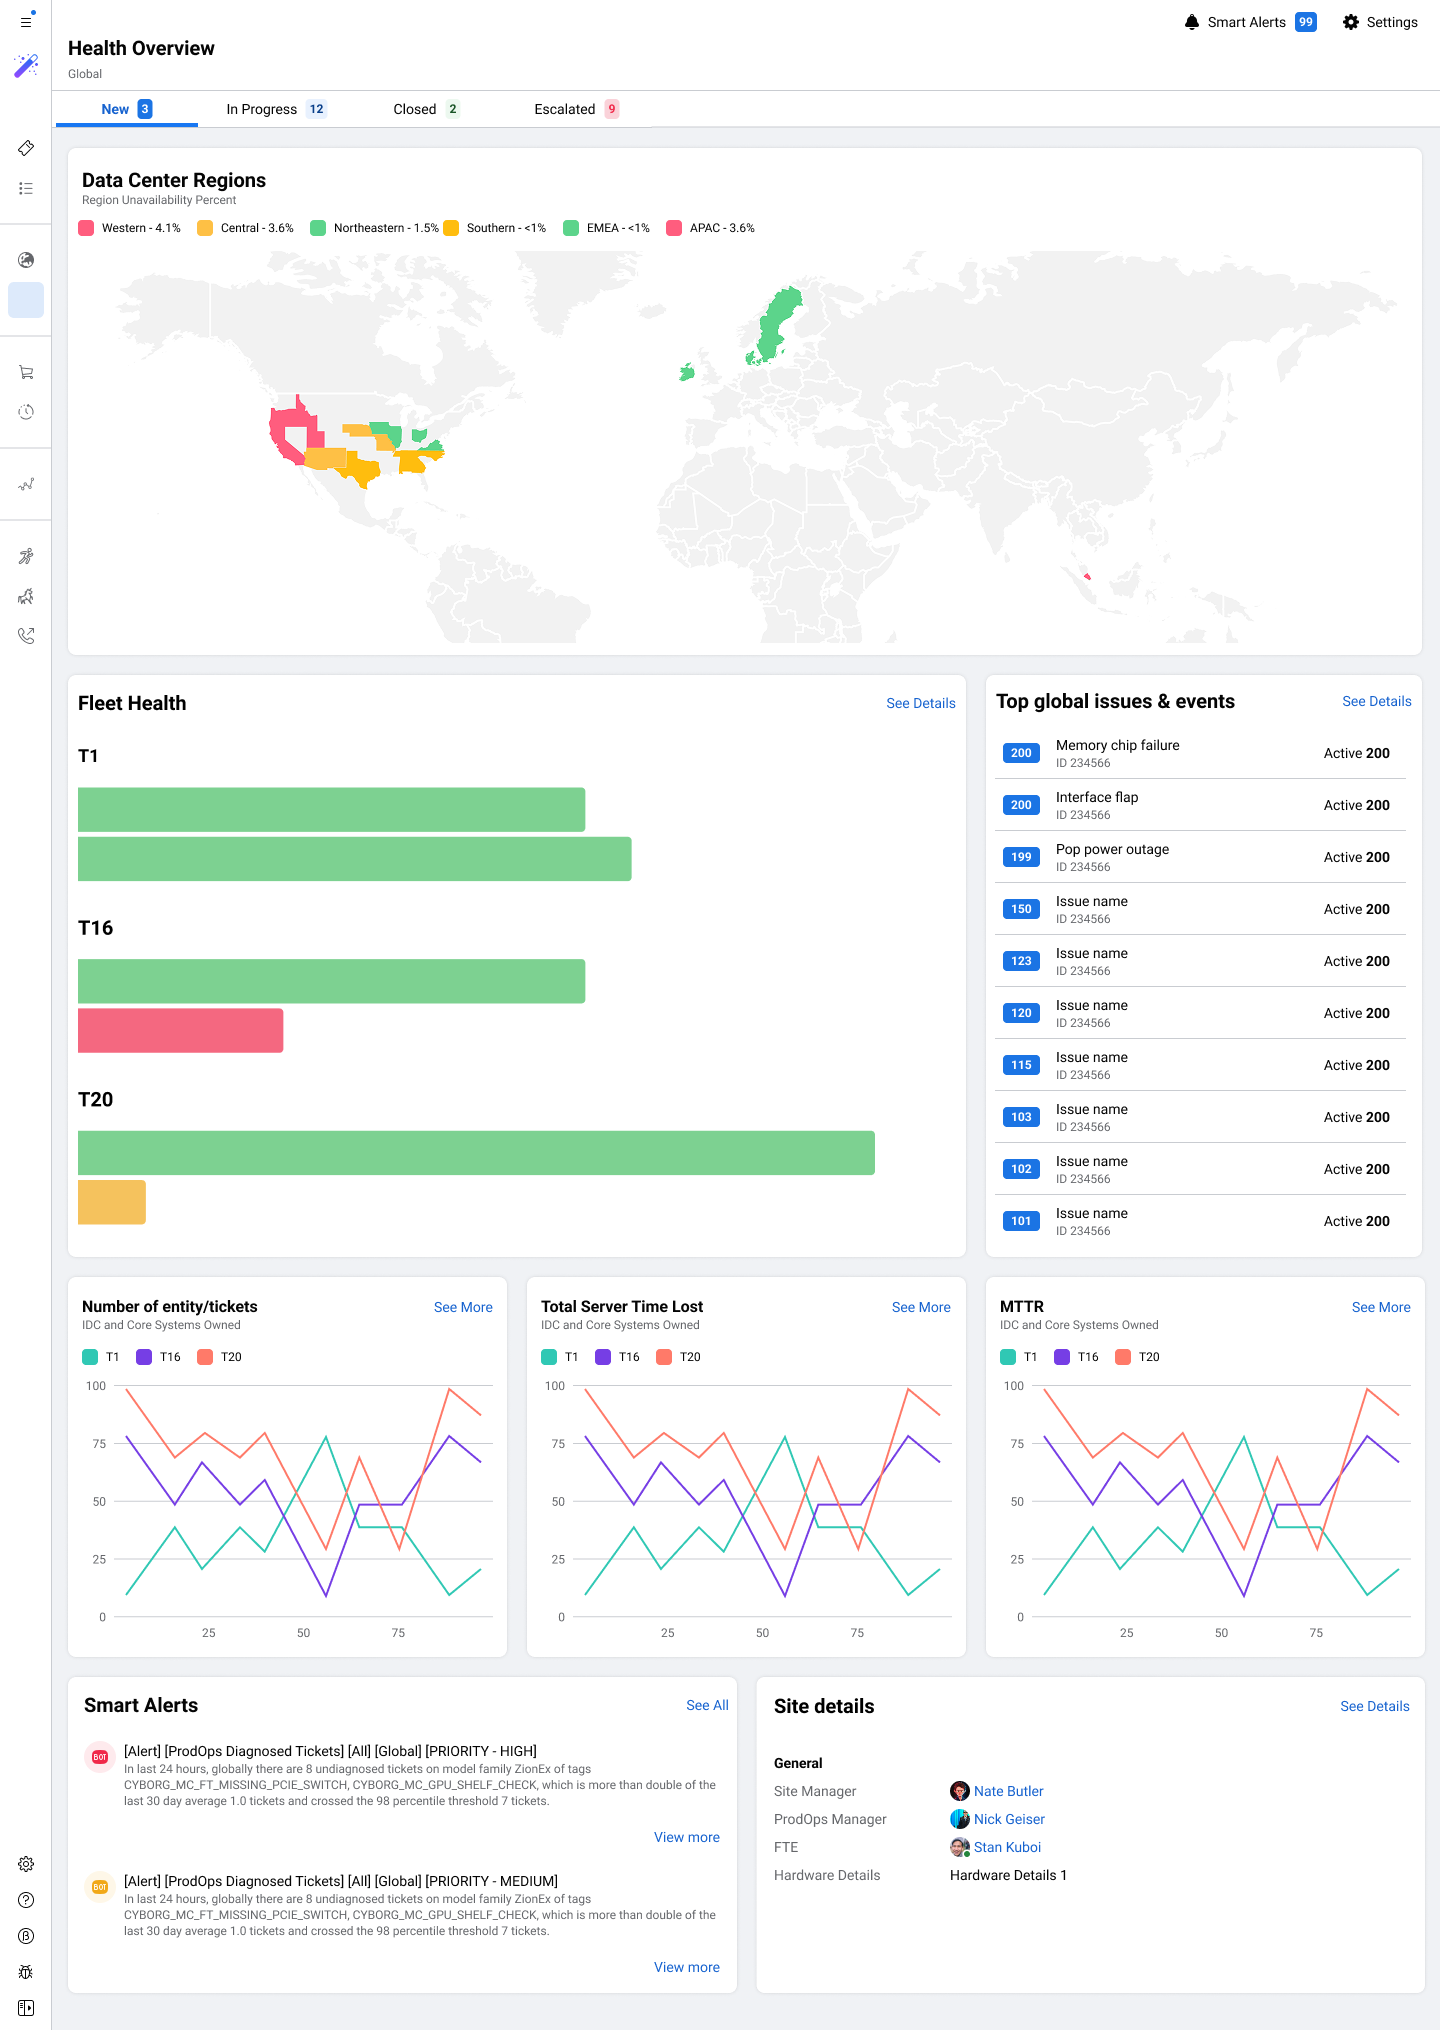
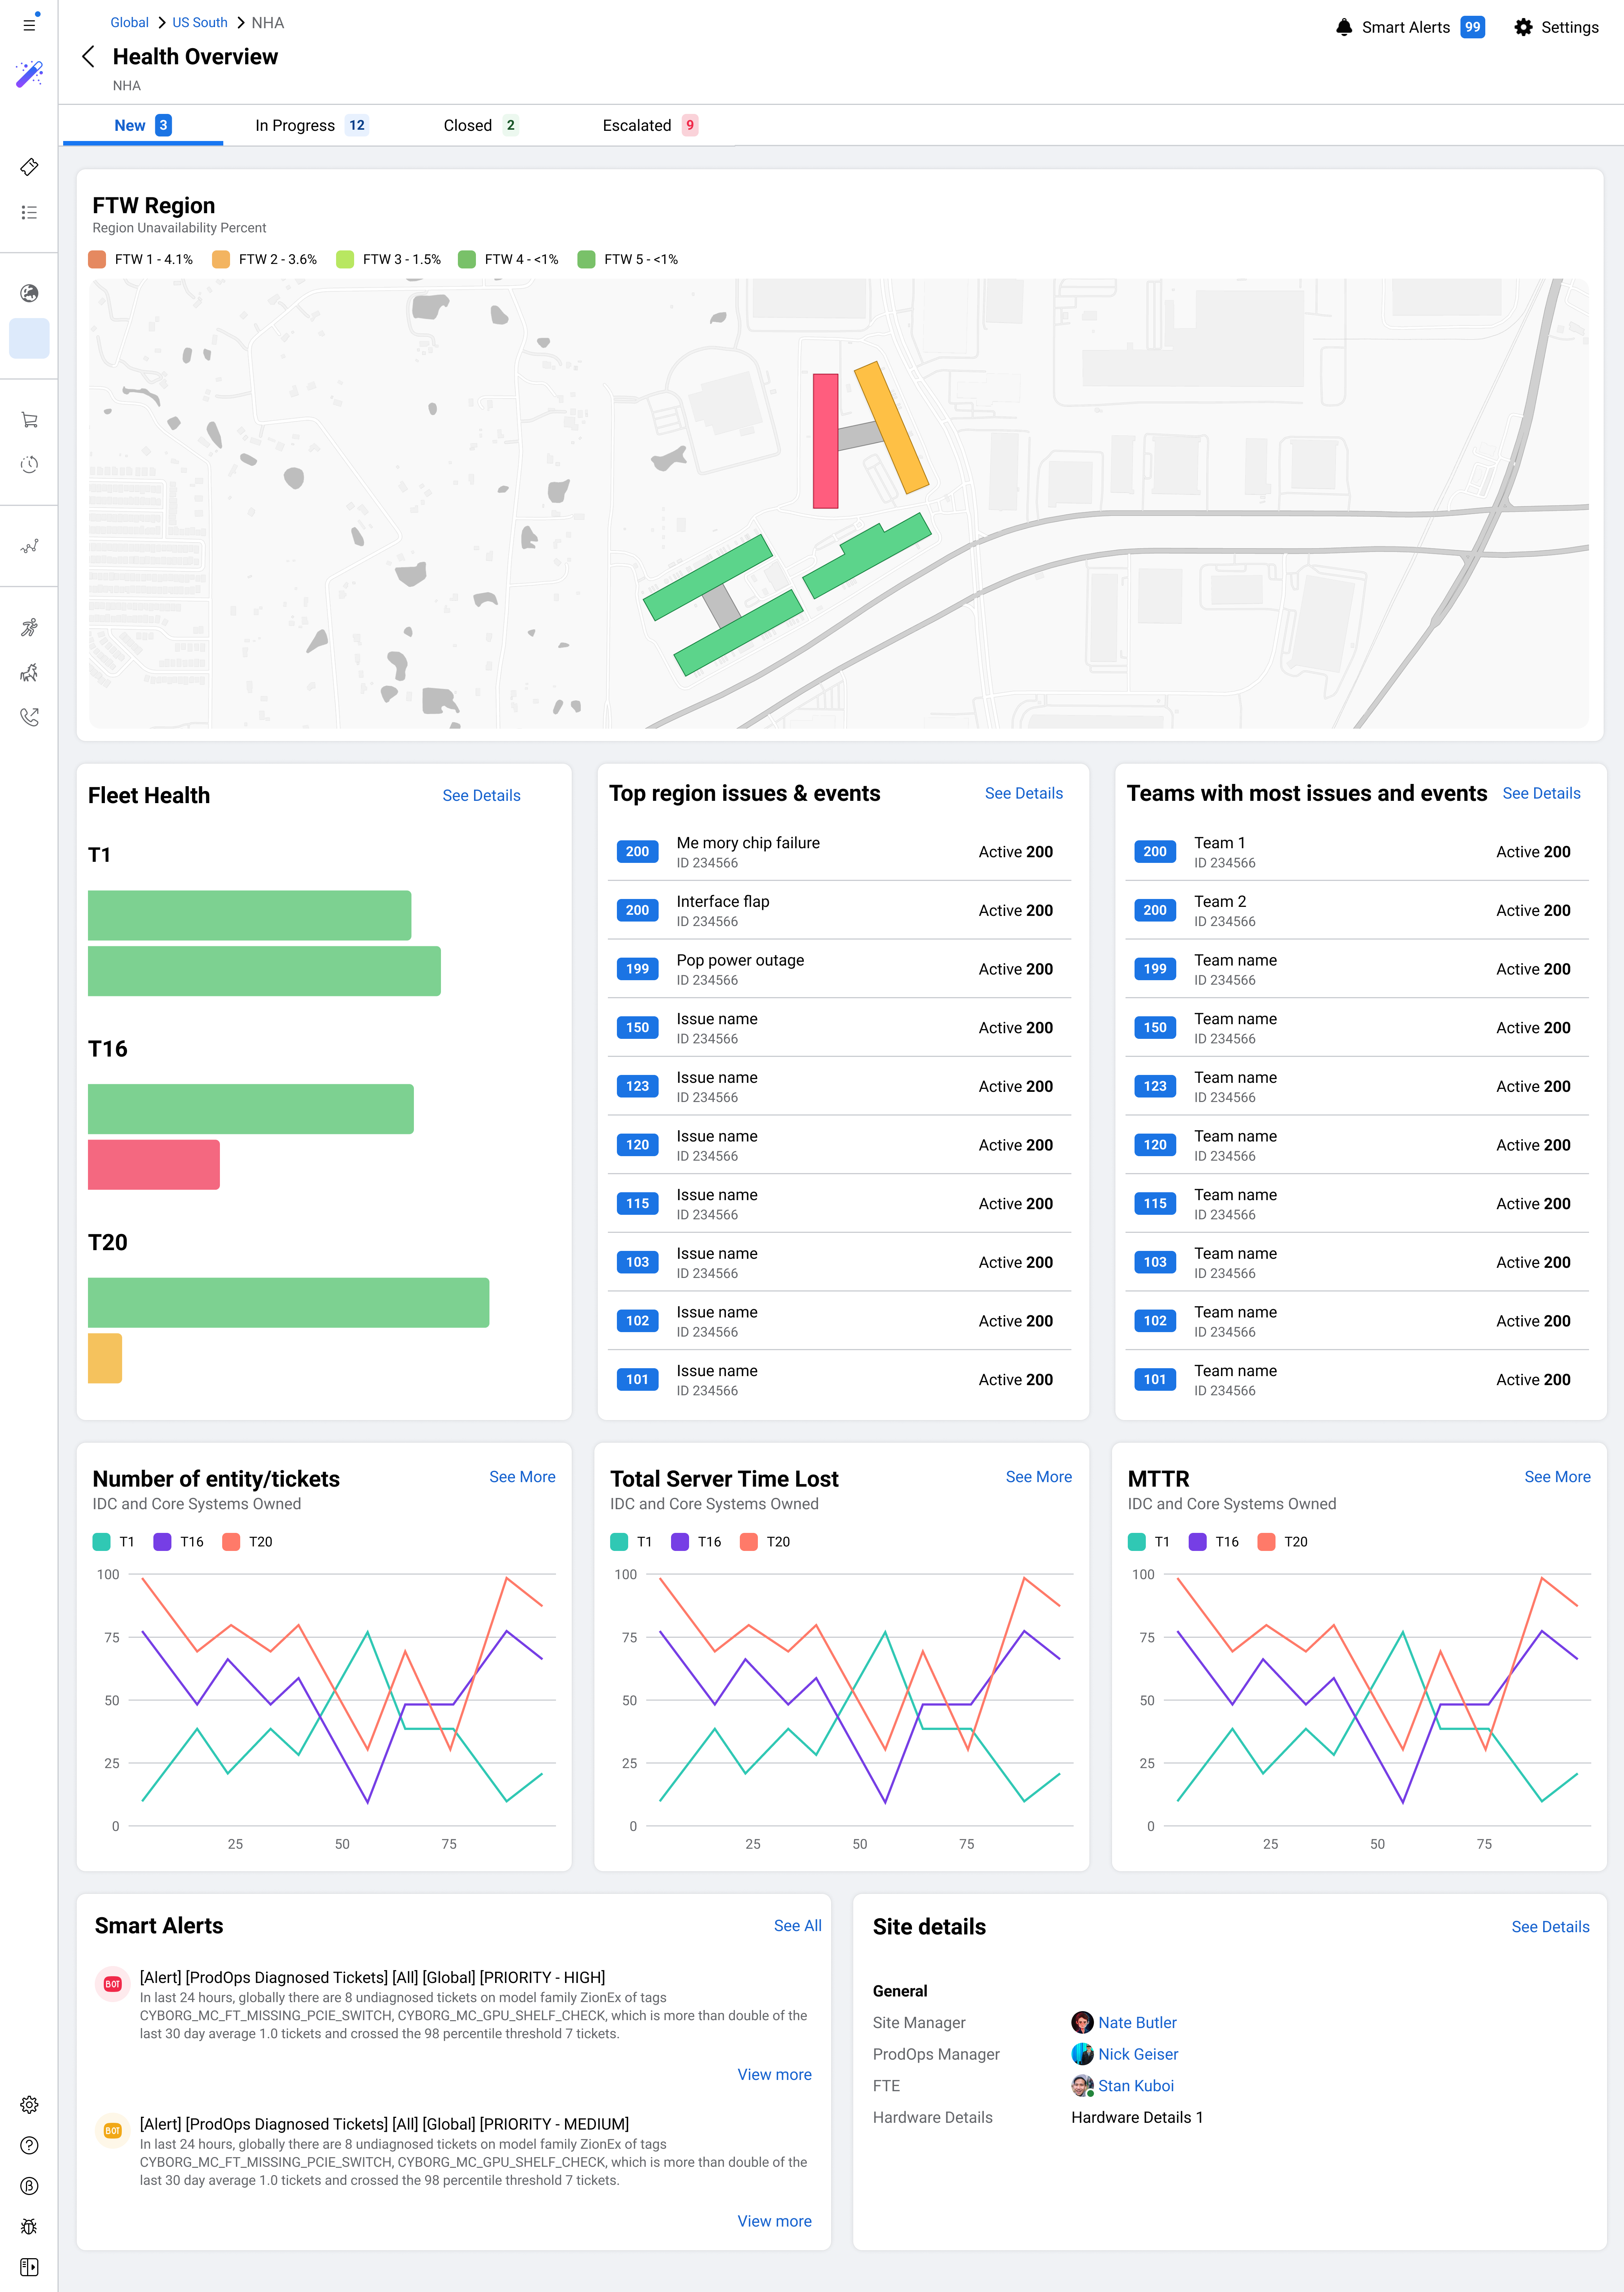
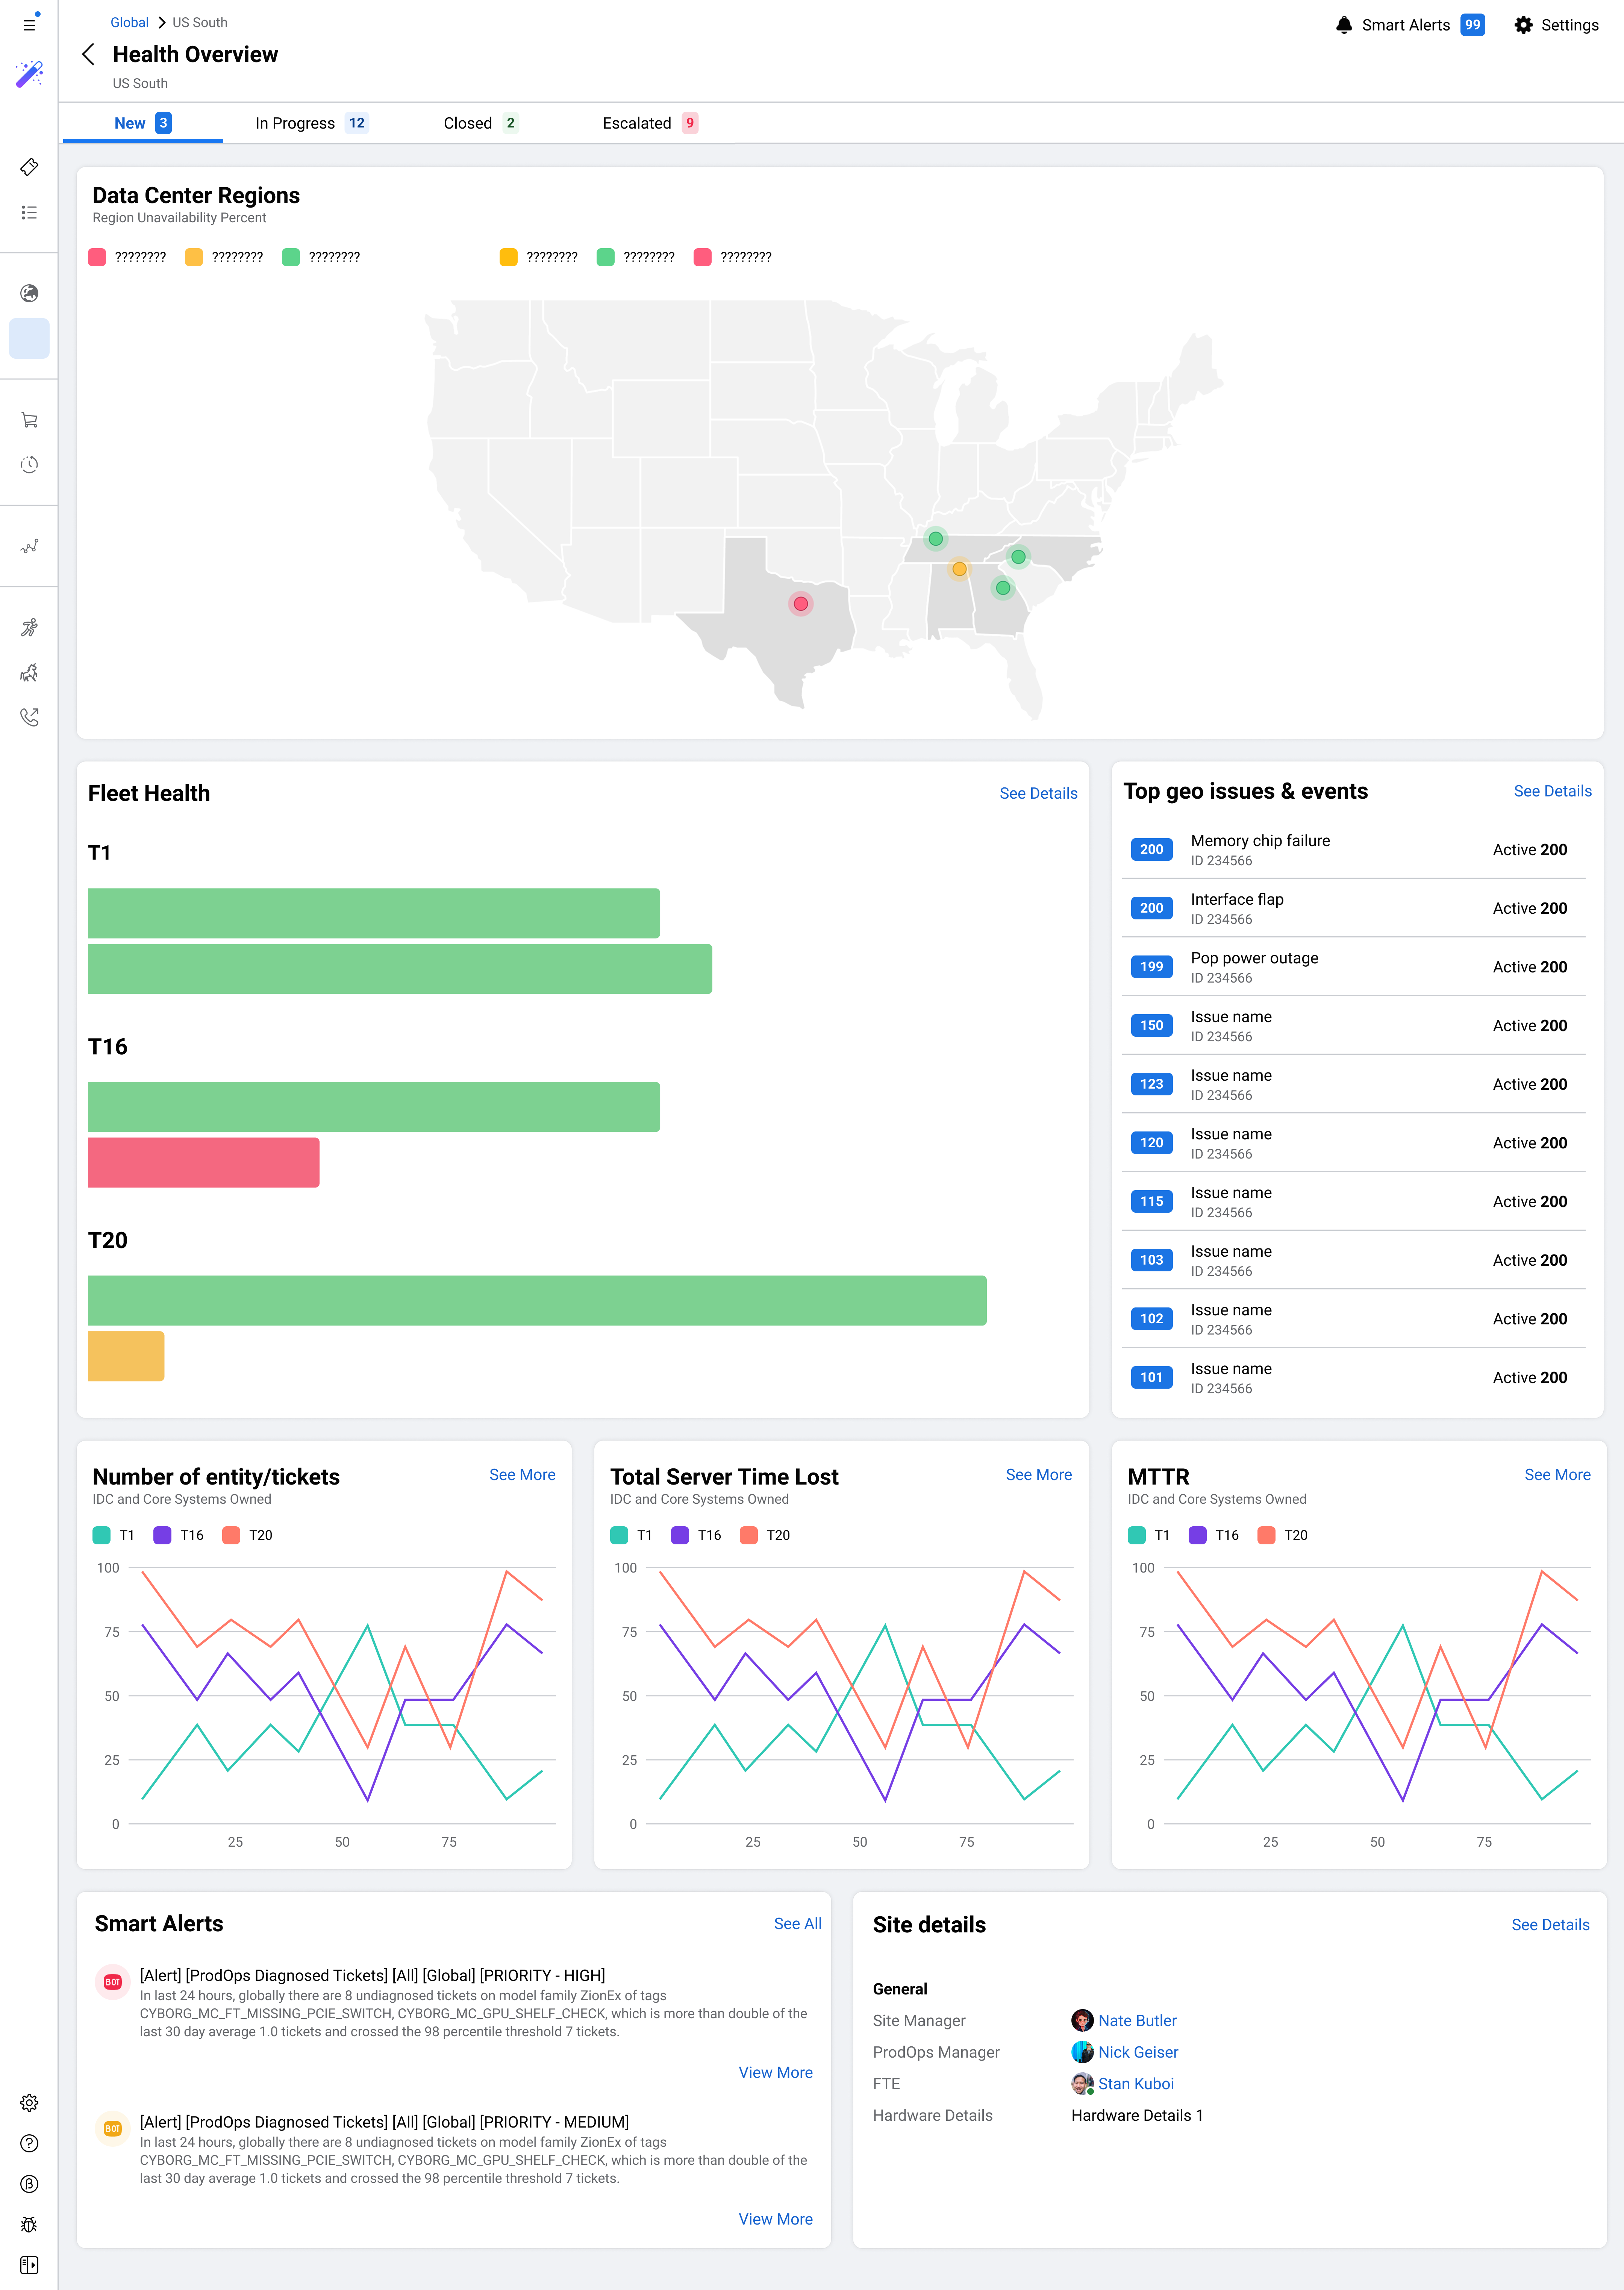
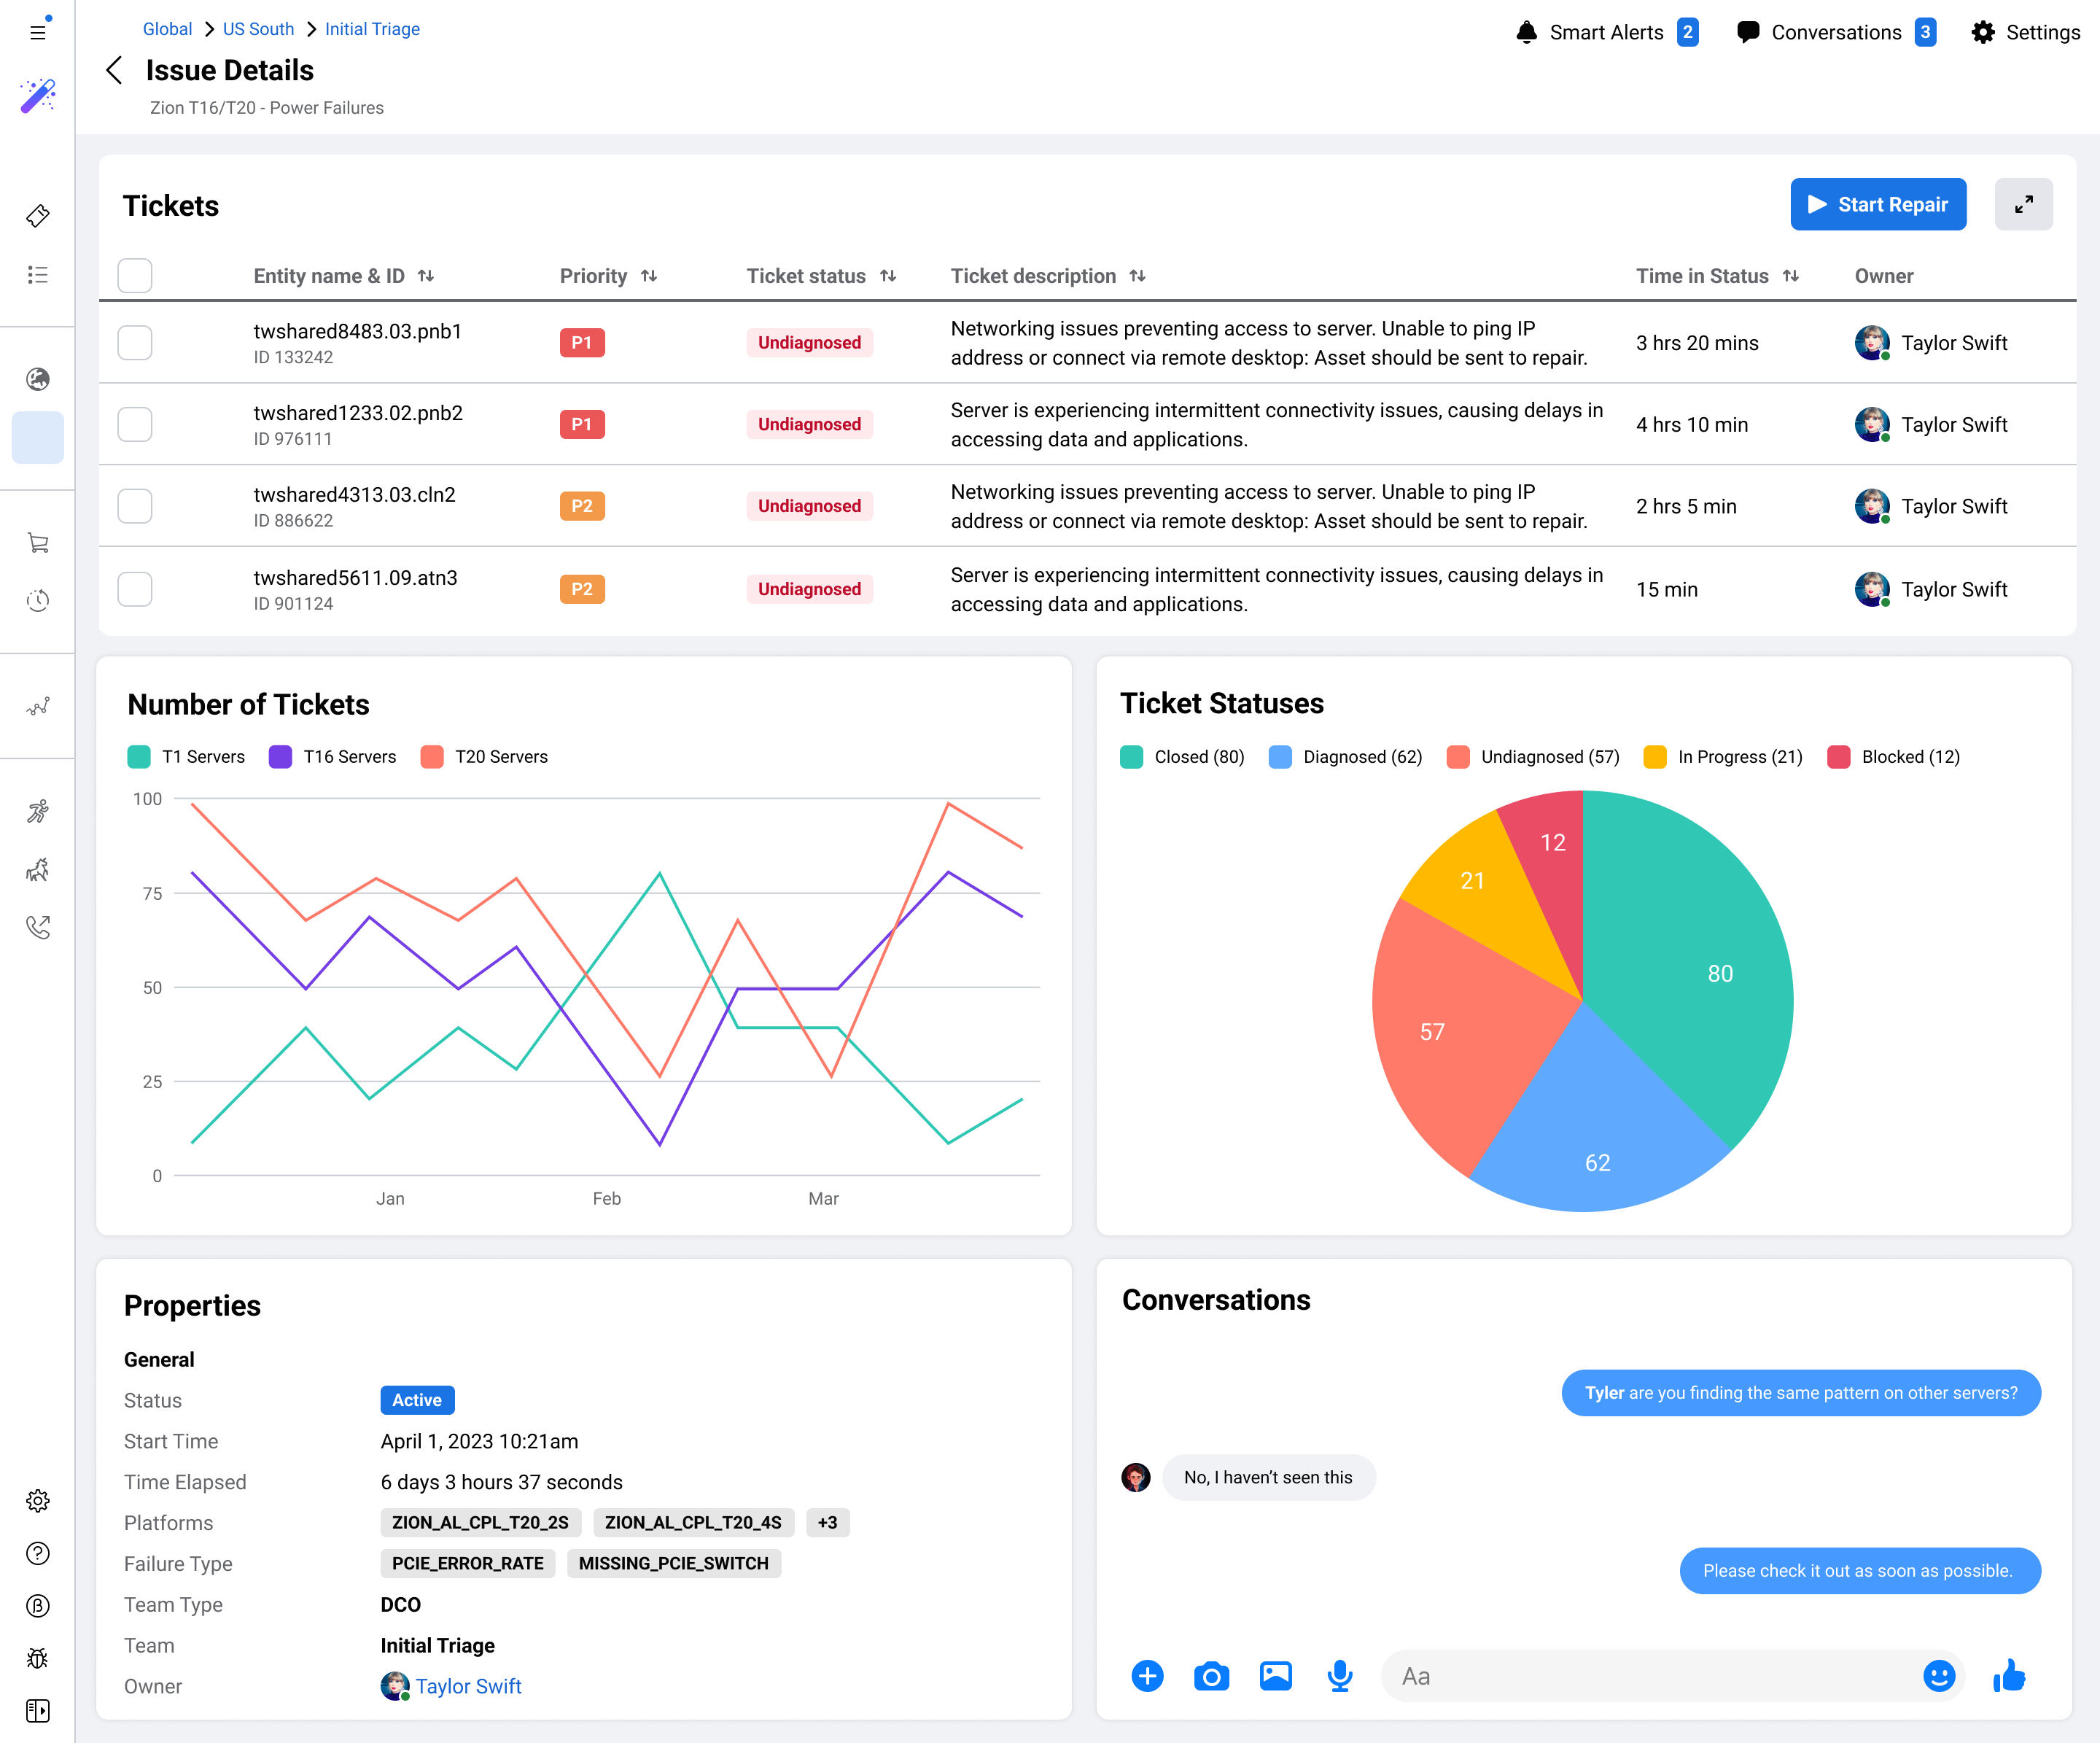
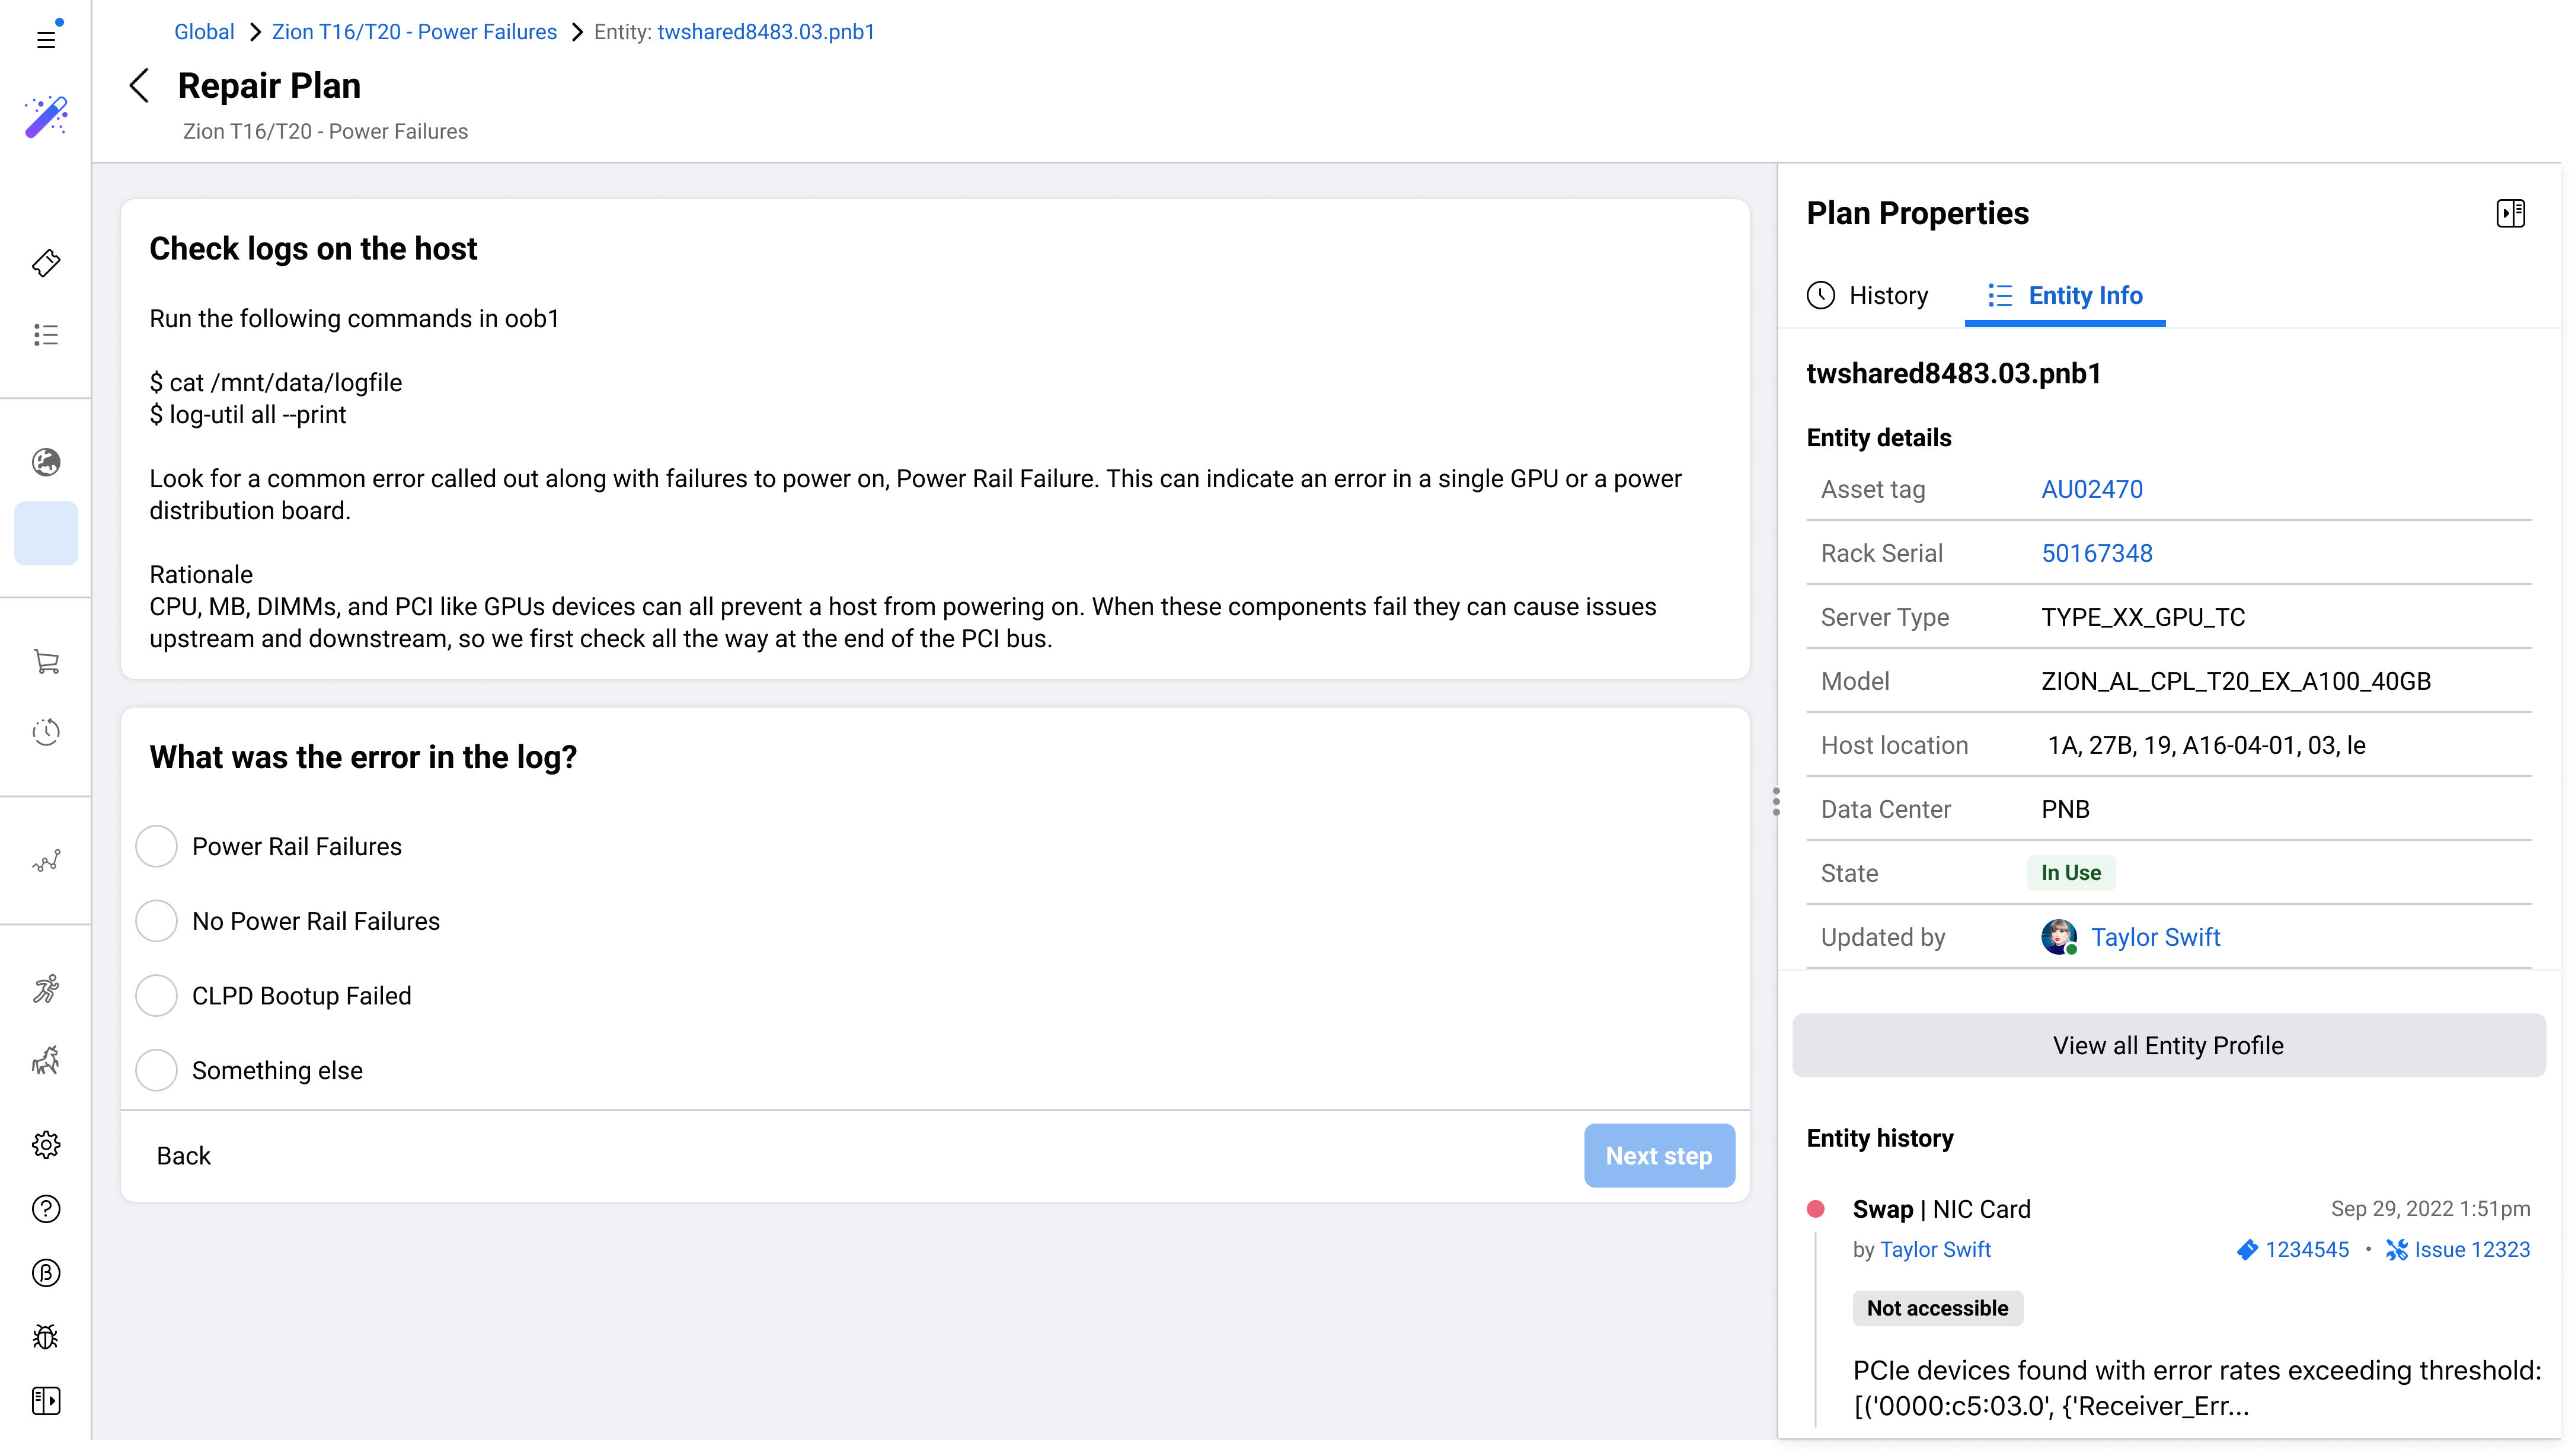
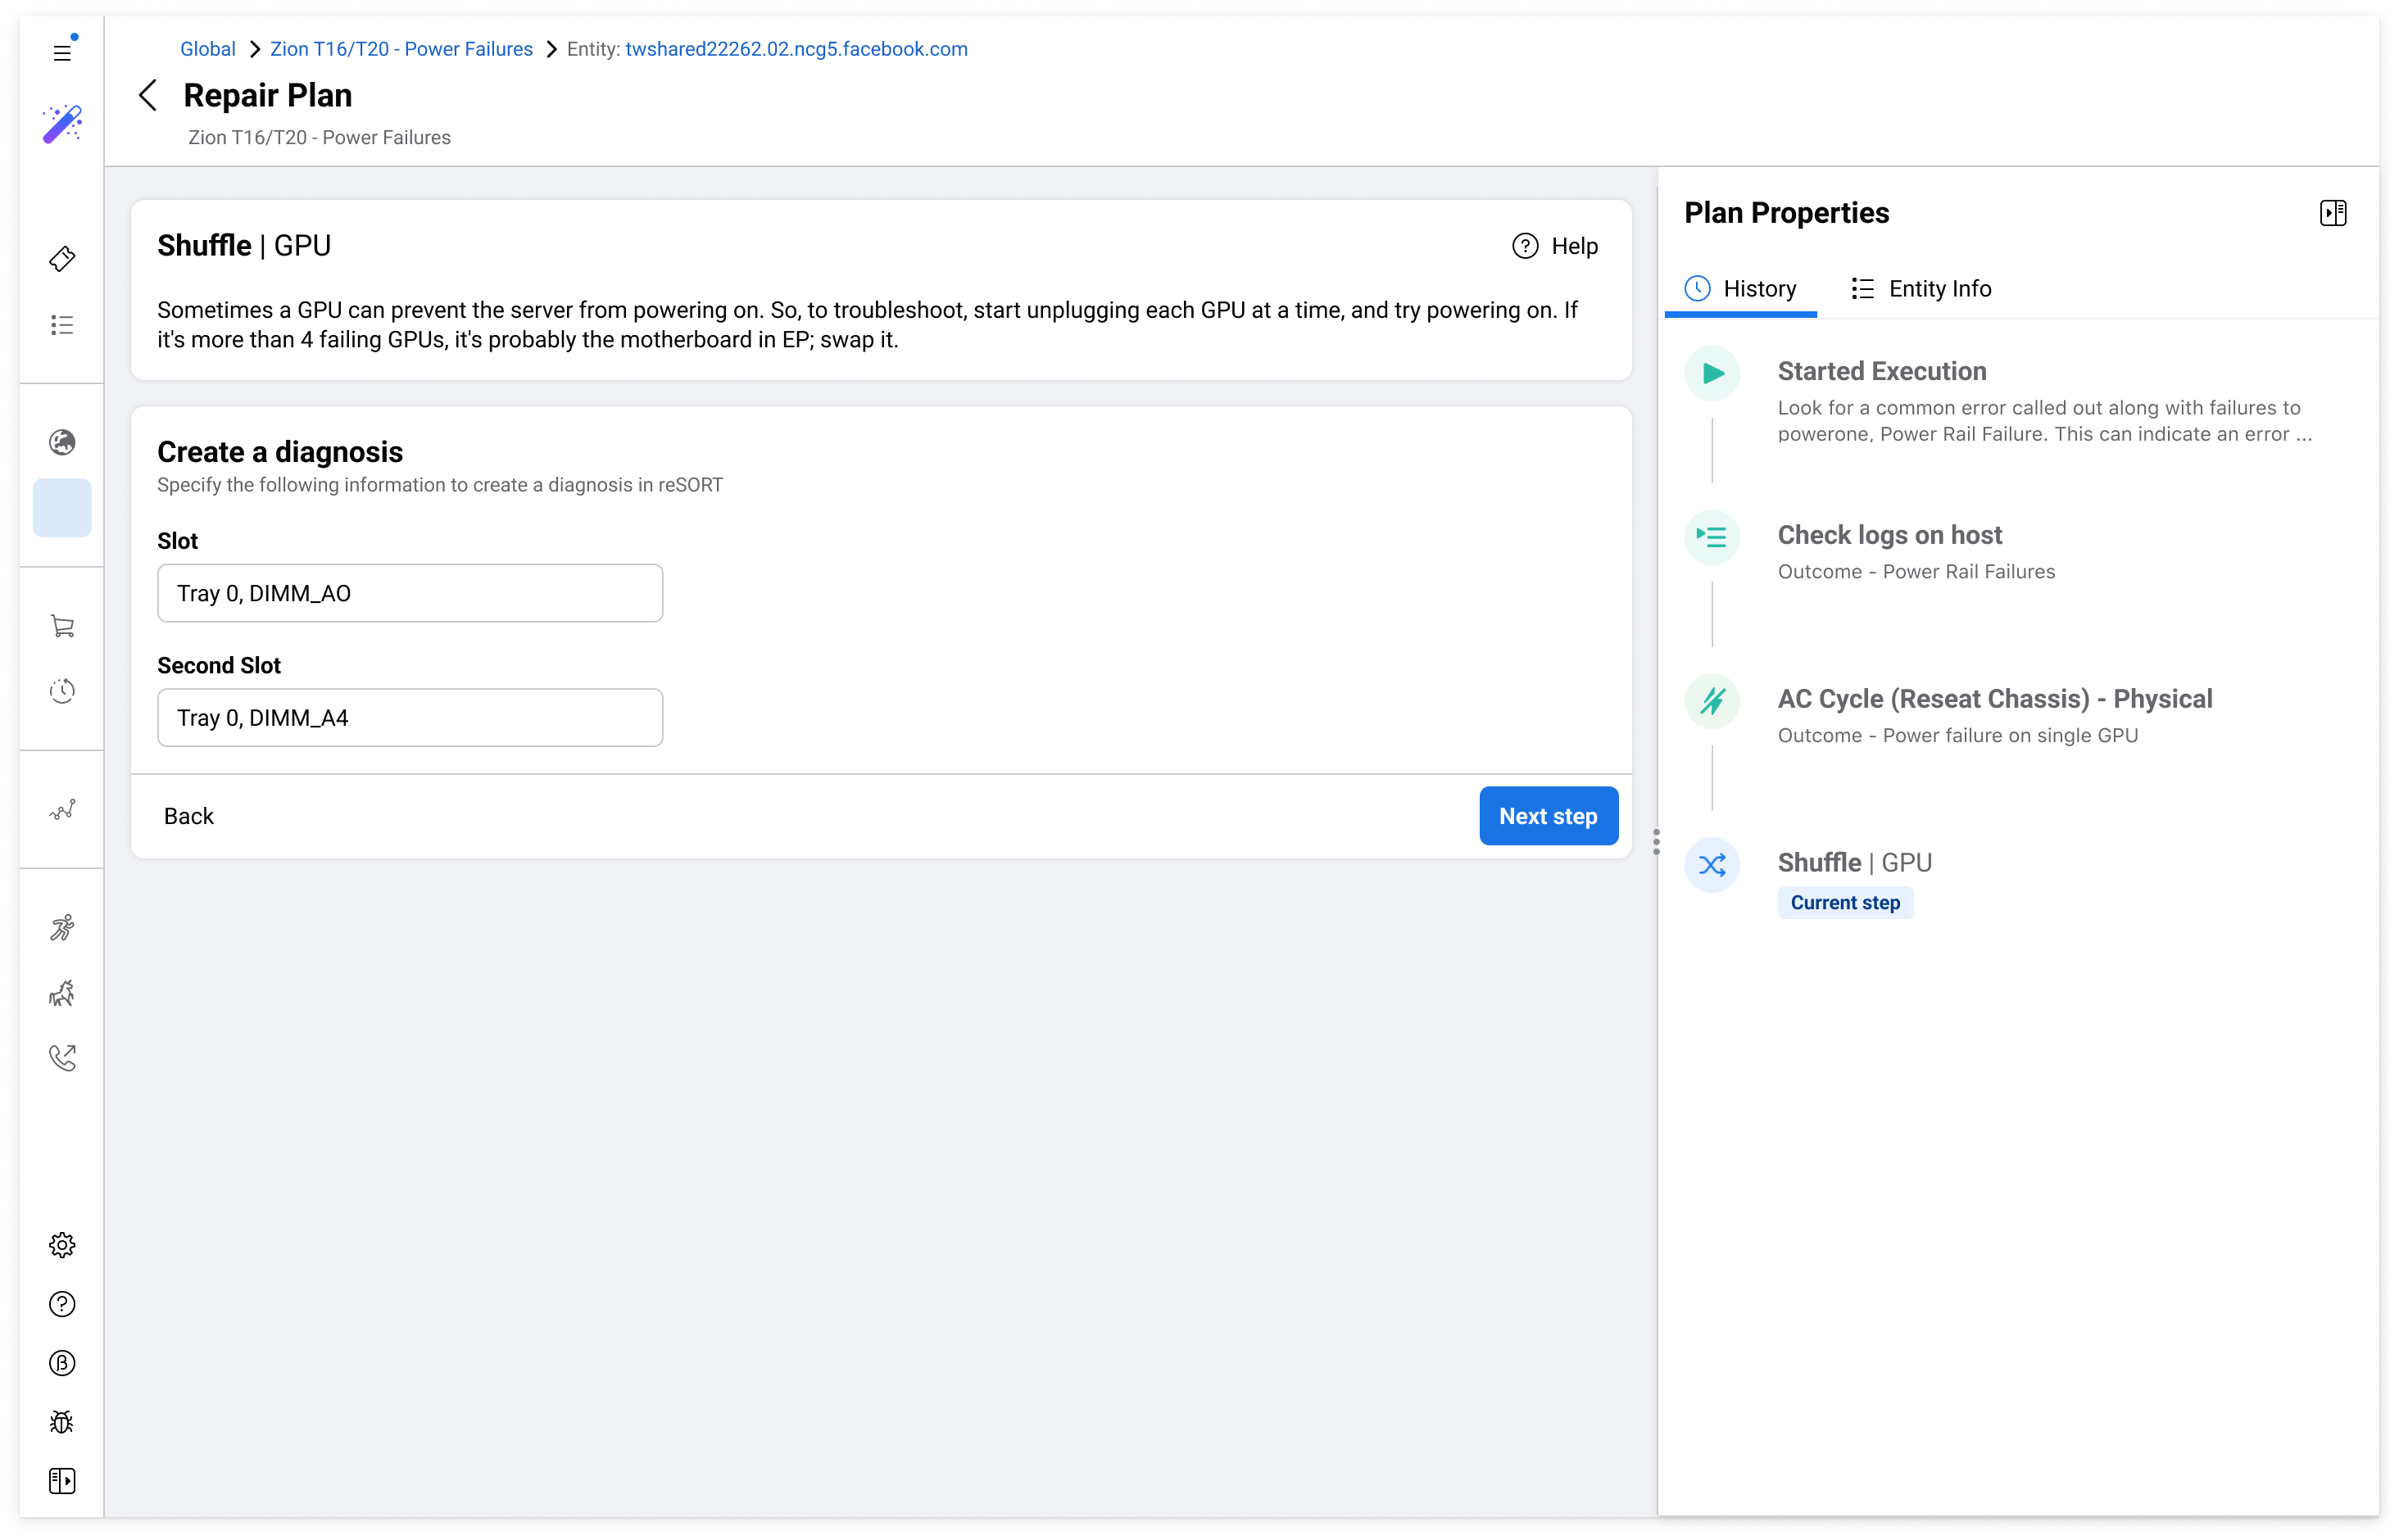
Redesigning how Meta repairs its global data centers
Meta's data centers keep Facebook, Instagram, and WhatsApp running for billions of people. I helped design Repair Console, a new internal platform to make server repair operations faster, more consistent, and scalable across the world.